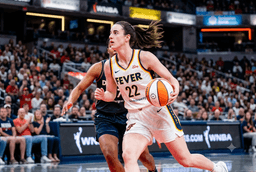
Caitlin Clark Year 3: Evolution of Her WNBA Shooting Range
Defenses are realizing that the usual scouting reports don’t work against Indiana Fever’s lead guard. Now in her third season, the numbers show she’s already adapted. She’s picking her shots more carefully, choosing high-value attempts instead of tough mid-range looks.
Her offense begins outside the three-point line in the WNBA. Opponents now guard her full-court, and her stats back up why that’s needed. When she pulls defenders out to the logo, it opens up space for her teammates to cut or post up. This season’s heatmap shows she takes most of her deep shots from the wings, showing how much attention she draws.
In her rookie year, she was still figuring things out, but now she plays with real strategy. She’s become more than just a shooter—she uses space to her advantage. The heatmap shows she’s especially efficient from the left side, where her step-back jumper against defenders is now a real weapon.
Analyzing the Perimeter Zones
The biggest change this year is that she’s stopped taking long two-pointers, often called the "dead zone." Now, she mostly shoots either at the rim or from three-point range.
• Left Wing: She still takes most of her shots from here, using high-ball screens to get just enough space for a quick shot.
• Paint: Her shooting percentage near the basket is up 8% from her first season, showing she’s better at finishing through contact against bigger defenders.
• Logo: She still takes plenty of long shots from 30 feet out, but she’s become more consistent from that range, making coaches rethink how to defend her.
By forcing defenders to cover the whole half-court, she changes the game for everyone. When defenders step out, she uses her quick first step to drive past them. This season’s heatmaps reveal a new "hot spot" near the basket from these drives.
The Playmaking Pivot
Shooter heatmaps usually miss the passing opportunities her threat creates. In her third year, her pressure on the perimeter leads to more "short roll" passes. When two defenders trap her in the pick-and-roll, it leaves the middle open.
She’s gotten better at reading the second defender. If the help stays with her, she scores. If the help rotates, she finds the open player in the corner. Now, her heatmap pairs with an "assist map," showing how her presence leads to more assists near the rim.
A New Blueprint for Backcourt Efficiency
These shooting charts show that the so-called "sophomore slump" didn’t happen for her. Instead, her third year is all about professional growth. She’s figured out where she’s most effective and takes more shots from those areas.
The result is a smarter, more dangerous offensive player. Now, defenses have to work even harder to stop her from changing how the court is played. Her heatmaps could set the standard for future high-usage guards.
The Long-Term Impact on Indiana’s Offense
The data shows that her third year is about more than just scoring—it’s about playing efficiently for the long term. By cutting out low-percentage shots and mastering the perimeter, she’s helped raise her team’s level. The heatmaps reveal not just ball movement, but how she pulls defenders. Now, the league has to figure out how to defend her unique range.
Stay on top of every fast break and buzzer-beater with TigerScores, your home for live NBA and college hoops updates. From real-time box scores to season-long player stats, we provide the essential data every basketball fan needs to follow the game.

FiberXers, Bossing chase share of group lead
Lastimosa, Rocacurva fuel Biñan rally to stun Cebu
Athletics extend streak to 12, strengthen hold on South lead
Alas Boys sweep Australia, stay on course for historic ninth-place finish
Thailand, Indonesia book semifinal berths in SEA V Cup
Fuel Masters acquire Mamuyac in trade with Elasto Painters
Voyagers pull away late to beat Kuyas, snap losing skid
Tuffin's clutch free throws lift Fuel Masters past Bolts for Group B lead
Gilas Boys capture Stop 3 crown, pull level with Belarus in Nations League
Akari-Rizal finish redemption run, capture first WMPBL championship